Every company in four cards: valuation, business, balance sheet and results
The Summary compares today's multiples (P/E, EV/FCF, P/B) with the company's own ten-year average and with its sector, and derives a reasonable price range and a one-word verdict. Below it, the Kaplio Reading answers the questions an investor asks: is it expensive? How is the business doing? Does the balance sheet hold up? What to expect from the next results?
- Valuation: P/E, EV/FCF and P/B against its own decade and its sector
- Business: sustained ROIC, margins, growth
- Balance sheet: net debt/EBITDA, liquidity, Altman Z
- Results: surprises against consensus and next date
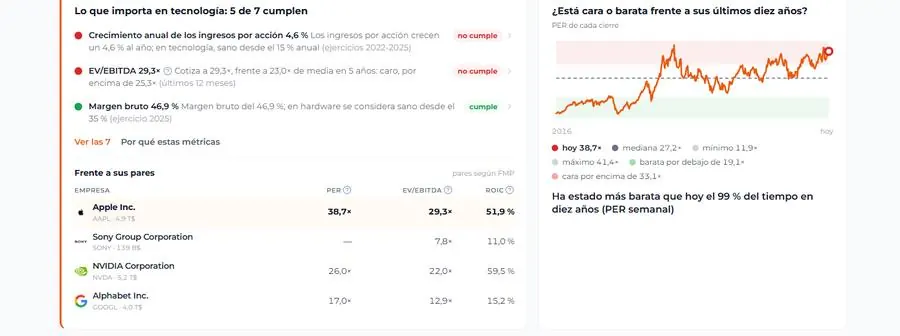
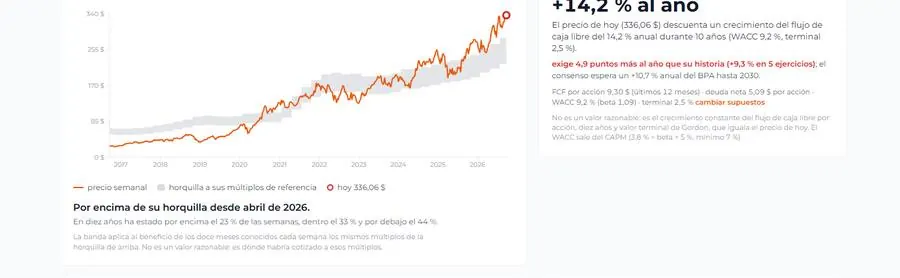
Valuation: price against its ten-year range
The weekly price over the band of multiples the company has earned over a decade, the three-year expected return based on consensus, and a reverse DCF that tells you what growth today's price is discounting. Valuation
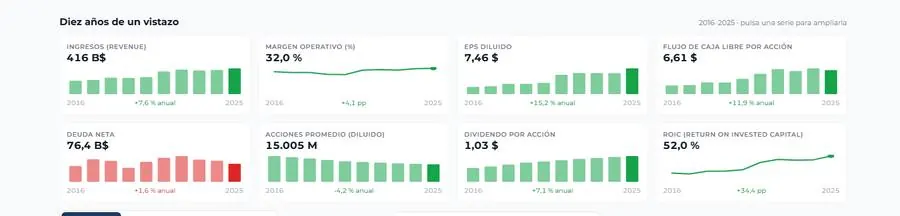
Financials: ten years of accounts at a glance
Revenue, operating margin, EPS, free cash flow, net debt, shares, dividend and ROIC year by year, with a TTM column, 2026 and 2027 estimates, templates for banks and insurers, and a traffic light per cell based on the sector guide. Financials
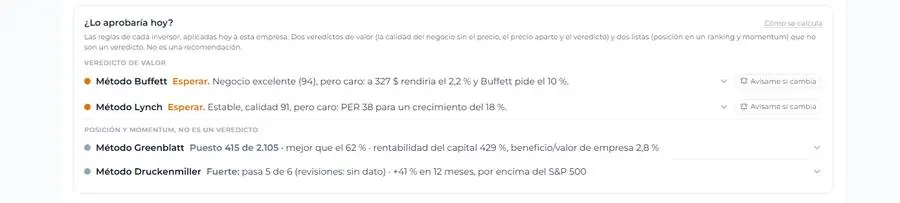
Would Warren Buffett approve it today? And Peter Lynch?
The Buffett Method and the Lynch Method are lists of rules drawn from their books and letters: margins, debt, return on capital, earnings growth and price paid. Kaplio checks each rule against the company's data and shows which ones it meets and which it does not, with the source next to it. No composite score: you see where it fails and where it stands out.
On top of that, the company's position in the Greenblatt formula ranking and Druckenmiller-style momentum, shown in grey because they are a position, not a verdict.
Weekly Radar, rankings and stock screener
Every Monday Kaplio runs the 500 companies of the S&P 500 through both methods and publishes who gets in, who drops out and who is at a buyable price. The screener filters the 2,044 companies above $2 billion with consistent data by its verdict, results, dividend and other filters, with six ready-made questions such as the Buffett method or the Lynch method.
S&P 500 Radar every Monday
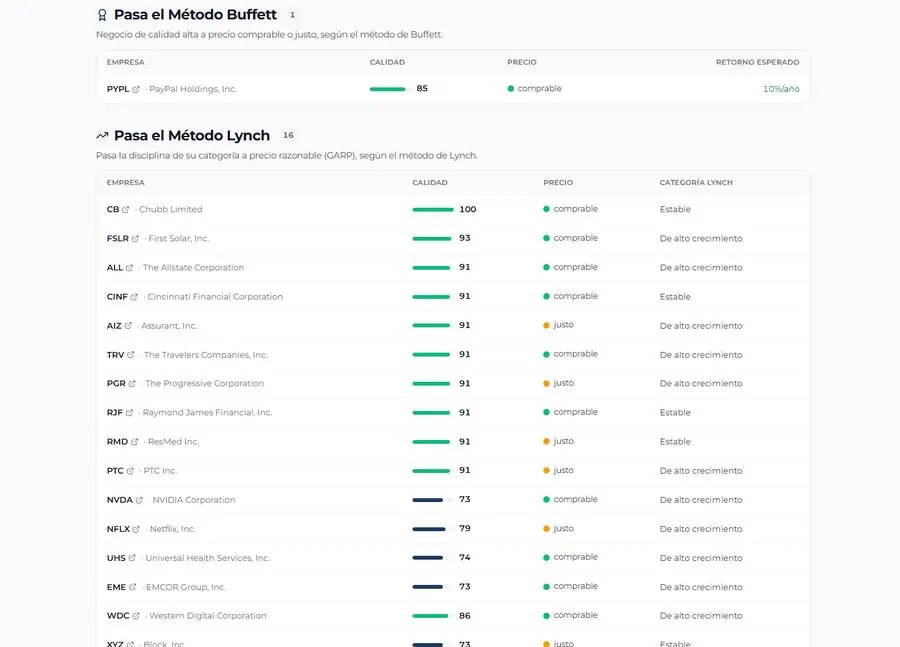
Who passes the Buffett Method, who passes the Lynch Method, who is quality but the method would wait for a better price and who is closest to passing. With the "Graham defensive investor" basket, the Greenblatt ranking and Druckenmiller momentum.
Latest Radar (October 5, 2026): 18 companies pass the Buffett Method, 54 the Lynch Method and 9 both, out of 500 screened. See the Radar
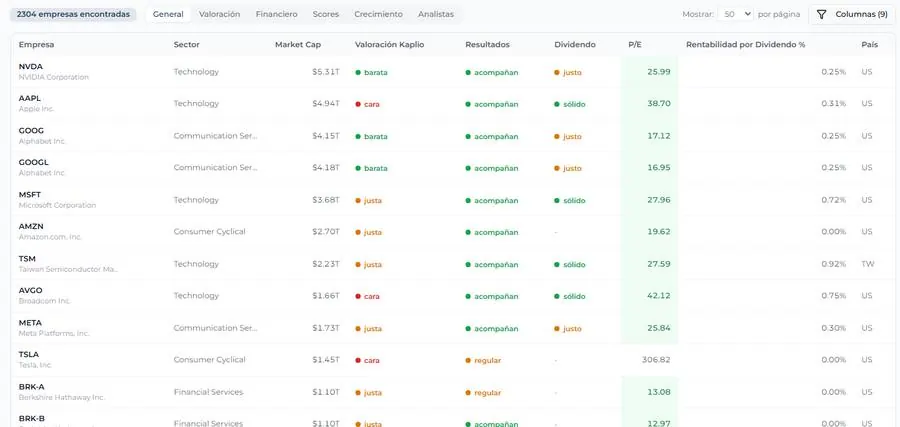
Stock screener with ready-made filters
Every row carries the Summary verdict: valuation, results, dividend and balance sheet. Filter by sector, market cap, ROE, ROIC, P/E, debt or analyst consensus, and save your filters.
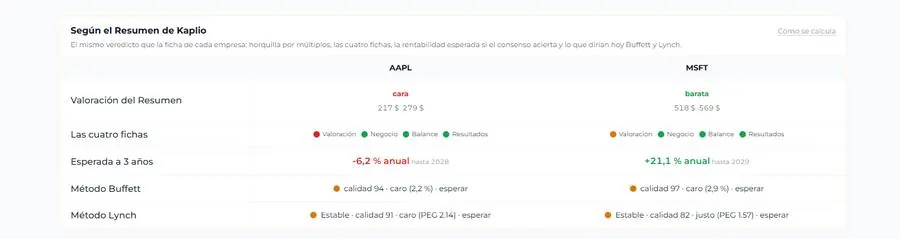
Compare stocks side by side with the same ratios
Up to four companies side by side: verdict and price range, the four cards, expected return, Buffett Method and Lynch Method, and any metric charted over five, ten or twenty years.
Watchlist, portfolio with a reading, and alerts
With a free account you save companies and record your positions. Each one goes through the same Summary as the company page, and we notify you in your dashboard when it changes; with Premium, by email too.
- Watchlist with traffic lights: Verdict, distance to the floor and the ceiling of the range, results in the next 14 days and your target price.
- Portfolio with a reading: Real return against the S&P 500 over the same dates, concentration, portfolio P/E and one sentence per position. Import a CSV from your broker.
- Price and method alerts: "Alert me if it drops 19%" or "alert me if the Buffett verdict changes". Three alerts with a free account, in your dashboard; unlimited and by email with Premium.
Learn to analyze companies: 66 lessons, from the P/E to free cash flow
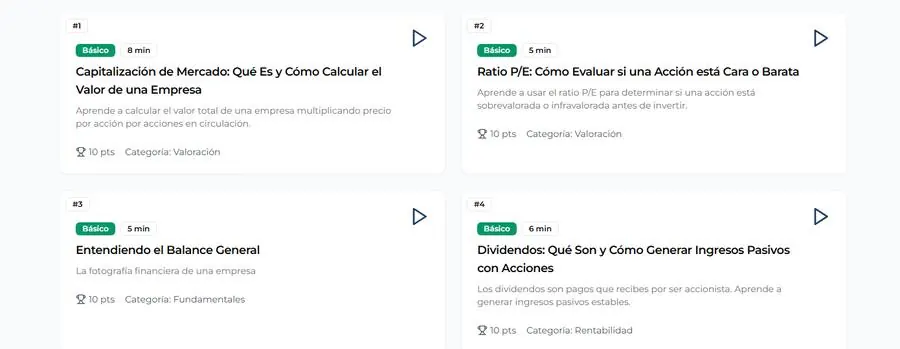
Six levels, from beginner to master, with five- to twelve-minute lessons, points and a leaderboard. Every metric on the company page links to its lesson, and every lesson to real companies where you can see it. The first five, without an account.
- What Is Market Capitalization and How Is It Calculated?
- What Is the P/E Ratio? How to Tell if a Stock Is Cheap or Expensive
- What Are Dividends and How Do You Calculate Dividend Yield?
How it works
- Search for a company: By name or ticker, among more than 10,000 companies with a page from the US and Canada.
- Read the verdict: Cheap, fairly priced or expensive, with the range and the four cards explained.
- Run it through the methods: Buffett and Lynch rule by rule; Greenblatt and Druckenmiller as a position.
- Follow it: Save it, record your portfolio and get a notice when something changes.
What is free and what Premium includes for €9 or US$9 a month
| No sign-up €0 | Free account €0 | Premium €9 or US$9 a month |
|---|---|---|
| Full company pages with 10 years of data | Everything above | Up to 20 years of accounts in tables and charts |
| Verdict, price range and methods | 2 watchlists of 20 stocks | Unlimited watchlists, portfolios and alerts, with email notices |
| Screener, Radar and rankings | Portfolio of 15 positions with a reading | Weekly summary of your portfolio every Monday |
| Compare companies | 3 price or method alerts, in your dashboard | Notice when the Buffett or Lynch Method verdict changes |
| Academy: first lessons | Monday Radar by email | |
| Full Academy with points | ||
| Analyze a company | Create a free account | See Premium |
No commitment. Cancel anytime.
Kaplio versus TIKR, Simply Wall St and Investing.com
Kaplio covers fewer markets than TIKR or Investing.com. In return, it is available in four languages (English, Spanish, Portuguese and French), gives an explicit verdict per company and applies the methods of specific investors rule by rule, with ten years of free data and no sign-up.
| Kaplio | TIKR | Simply Wall St | Investing.com | |
|---|---|---|---|---|
| Languages | English, Spanish, Portuguese, French | English, translated | English | Translated portal |
| Cheap / fairly priced / expensive verdict | Yes, with range and rule | No | Fair value (DCF) | Fair value (Pro) |
| Buffett and Lynch methods rule by rule | Yes, with the source | No | No | No |
| Years of data without sign-up | 10 | Account required | Limited | Limited |
| Subscription price | €9 or US$9 a month | from $24.95 a month (Plus); Pro $54.95 | Premium $15.99 a month ($10.95 billed annually); Unlimited $21.50 a month, annual only | InvestingPro from $17.95 a month; $8.08 billed annually |
Public prices as of 17 September 2026 in dollars; TIKR, Simply Wall St and Investing.com have a limited free plan and occasional offers.
Who is behind it and where the data comes from
Kaplio is built in Spain, independently and with no ties to brokers or asset managers. Financial statements and quotes come from a professional financial data provider, with daily closes and quarterly and annual accounts as each company publishes them. Every company page shows the date of the latest data. About Kaplio
This is not advice
Kaplio is an educational and analysis tool. No verdict is a recommendation to buy or sell: each one comes from a rule published in the methodology and from a data point you can check.
Frequently asked questions
What is Kaplio and who is it for?
Kaplio is a fundamental analysis tool for individual investors, available in English, Spanish, Portuguese and French. Search for any company listed in the United States or Canada and you will see its valuation, its business, its balance sheet and its results with ten years of data, a clear verdict and what the Buffett and Lynch methods would approve today.
Is it free? Do I need to sign up?
Yes. Company pages, the screener, the weekly Radar, the rankings and the first lessons are free to use without sign-up, with ten years of data. Signing up, also free and with no card, adds a watchlist, a portfolio and three alerts shown in your dashboard. Premium costs €9 or US$9 a month, extends the series up to twenty years and gives unlimited alerts by email. Premium has no free trial; cancel whenever you like.
How does Kaplio work out whether a stock is cheap or expensive?
It compares current multiples (P/E, EV/FCF, P/B and others) with the company's own average over the last ten years and with its sector. From there it derives a reasonable price range and a one-word verdict. It is not a prediction or a recommendation: it is an orderly reading of the data using the published methodology.
What are the Buffett Method and the Lynch Method?
They are lists of rules taken from how each investor described his criteria: margins, debt, return on capital, earnings growth and price paid. Kaplio checks each rule against the company's data and shows which ones it meets and which it does not, with no composite score, so you can see exactly where it fails or where it stands out.
What sets Kaplio apart from TIKR, Simply Wall St or Investing.com?
Kaplio is available in four languages, gives an explicit verdict per company and applies the methods of specific investors rule by rule. It covers fewer markets than TIKR or Investing, but offers ten years of free data without sign-up and a 66-lesson academy integrated with the company pages.
Where does the data come from and how often is it updated?
Financial statements and quotes come from a professional financial data provider, with daily closing data and quarterly and annual accounts as each company publishes them. The S&P 500 Radar is recalculated every Monday. Kaplio does not provide financial advice and every company page shows the date of the latest data used.
Start with the company you have in mind
No sign-up, no card. Ten years of data and a verdict in ten seconds.
Top stocks
- NVIDIA Corporation (NVDA) — stock analysis
- Apple Inc. (AAPL) — financials
- Alphabet Inc. (GOOGL) — valuation
- Alphabet Inc. (GOOG) — fundamental analysis
- Microsoft Corporation (MSFT) — stock analysis
- Amazon.com, Inc. (AMZN) — financials
- Taiwan Semiconductor Manufacturing Company Limited (TSM) — valuation
- Decarbonization Plus Acquisition Corporation III (DCRC) — fundamental analysis
- Space Exploration Technologies Corp. (SPCX) — stock analysis
- Meta Platforms, Inc. (META) — financials
- Broadcom Inc. (AVGO) — valuation
- Tesla, Inc. (TSLA) — fundamental analysis
- SK hynix Inc. (SKHY) — stock analysis
- Micron Technology, Inc. (MU) — financials
- Berkshire Hathaway Inc. (BRK-B) — valuation
- Berkshire Hathaway Inc. (BRK-A) — fundamental analysis
- Eli Lilly and Company (LLY) — stock analysis
- Advanced Micro Devices, Inc. (AMD) — financials
- JPMorgan Chase & Co. (JPM) — valuation
- Walmart Inc. (WMT) — fundamental analysis
- ASML Holding N.V. (ASML) — stock analysis
- Exxon Mobil Corporation (XOM) — financials
- Visa Inc. (V) — valuation
- Johnson & Johnson (JNJ) — fundamental analysis
- Intel Corp. (INTC) — stock analysis
- Mastercard Incorporated (MA) — financials
- AbbVie Inc. (ABBV) — valuation
- Cisco Systems, Inc. (CSCO) — fundamental analysis
- Lam Research Corporation (LRCX) — stock analysis
- Palantir Technologies Inc. (PLTR) — financials
Sectors
Learn & Research
- Investment Academy — 66 free lessons on value investing
- Methodology — How Kaplio judges a company
- Stock Screener — Filter by ratios, sector and valuation
- Discover — Top opportunities, trending stocks, sectors
- Weekly Radar — S&P 500 through the Buffett and Lynch Methods every Monday
- Markets — Quotes for indices and currencies